
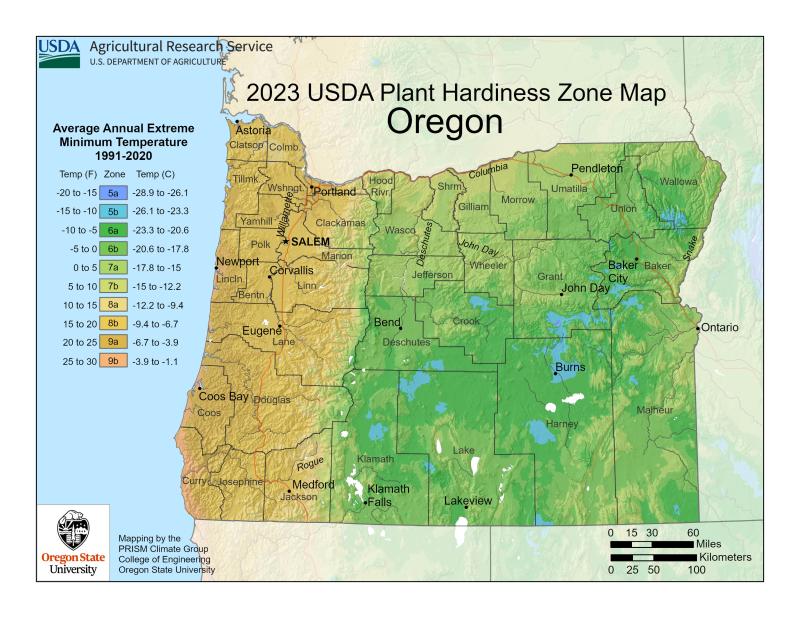
With spring planting in full swing, it’s time to update our expectations for plant performance and longevity. A valuable tool for gardeners and researchers, the USDA has updated its Plant Hardiness Zone Map for the first time since 2012.
The zones identify average extreme minimum temperatures and help gardeners to determine which perennial plants are most likely to thrive.
Approximately 80 million American gardeners and growers represent the most frequent users of the Hardiness Zone Map. Other users of the zone map include the USDA Risk Management Agency which sets certain crop insurance standards and scientists who use the zone data in many research models such as those modeling the spread of exotic weeds and insects.
The stats for my zip code 97471 are a change from zone 8b to 9a. The zone 8b range of average cold temp is 15-20 degrees.
The zone 9a range of average cold temp is 20-25 degrees.
For my zip code, the map shows a 2 degree raise in average cold temps.
It is interesting to see that nearly 60% of Oregon land stayed in the same zone, ie: Portland and much of the Willamette Valley. But 38.6% of Oregon land shifted warmer to the next 1/2 zone and about 1% moved a full zone warmer. Just 2.5% moved to a cooler zone. These new stats for the zone map are based on a 30year average of the lowest annual winter temperature at specific locations. It incorporates data from 13,412 weather stations compared to the 7983 that were used for the 2012 map.
Go online to https://planthardiness.ars.usda.gov/ to see the new map zones.
See you in the garden…and at the PLANT EXPO on May 4th!